 -- this is image "aa"
 -- this is image
"bb", the big black particle has moved slightly to the right.
Sometimes our images are too noisy to effectively track particles. We wrote this software to do particle image velocimetry (PIV) with those types of images. An early version (dpiv.pro) was written by Doug Anderson (andersondoug(at)gmail.com), and was slightly modified by Eric Weeks (epiv.pro). circ is called by pivplot, it makes the user-defined plot symbol (plot symbol 8) to be a circle. mydiff3 is called by epiv just to make a picture while the analysis is being done.
The idea of PIV is fairly simple. Take two pictures that are slightly different from each other. Consider a small region of the first picture, say 10 x 10 pixels. Compare that region with 10 x 10 pixel regions of the second picture that are close to where the original region was taken from. The region from the second picture that most closely resembles the first picture's region then indicates that whatever you're looking at has moved over to the position of the second region. (If the region in the second picture has the same location as the original region, then nothing has moved.) Thus, this measures a displacement vector for the position of the original region. By checking regions everywhere in your picture, you get a displacement vector field.
| DISCLAIMER: Note that there's very fancy ways to implement PIV (see here for example) and we make no claims for accuracy or reliability of our code. For example, the program tries to use subpixel accuracy but often seems to return values that are stuck at the pixel location. If we improve the program, we'll post the updated version here (or if someone else improves it, please email Eric Weeks your improved version! My email address is at the bottom of this page.) |
How to use the programs
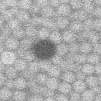
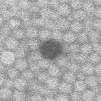
You start with two images that are (hopefully) slightly different, such as these two:
 -- this is image "aa"
 -- this is image
"bb", the big black particle has moved slightly to the right.
IDL> help,aa,bb
aa             BYTE     = Array[101, 101]
bb             BYTE     = Array[101, 101]
IDL> piv=epiv(aa,bb,6)
This runs the PIV algorithm on the two images, allowing the comparison region in the 2nd image to shift by as much as 6 pixels in any direction relative to the location of the comparison region in the 1st image. In other words, your displacement vectors will be a maximum of 6 pixels long.
The output data has the following form: IDL> help,piv
piv FLOAT = Array[96, 96, 4]
Essentially, four 96 x 96 arrays. The 96 x 96 is because the program crops in a little bit from each edge, to allow the comparison region in the 2nd image to be taken with a position up to 6 pixels shifted in any direction. The arrays are:
There are several keywords you can use:
unsupported/undocumented keywords:
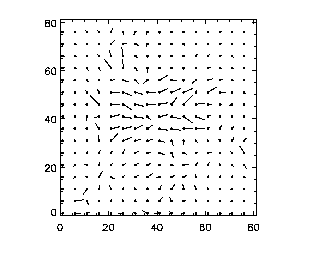
IDL> pivplot,piv

(Actually, I added the keyword "charsize=2" to the command to make the size of the axis labels larger for this figure.) pivplot takes several keywords:
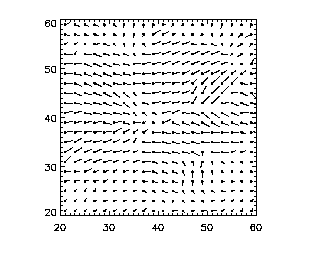
For example:
IDL> pivplot,piv,charsize=2,spacing=2,xrange=[20,60],yrange=[20,60]
