Click on the picture for a movie of particles flowing through a 50 um wide tube. The pump rate for this experiment is 1.2 uL/hour or 10 mL/year. Chaining and plug flow have been observed in these experiments.
What is so unique about the flow of colloidal particles? How can these properties be observed on the inter-particle level? Is there a way to quantify the behavior of colloidal flow systems as a function of flow rate, channel size, concentration, time, or some other parameters? These are just some of the questions that we are asking. For some of the answers, you may want to read our related papers:
|
|
Click on the picture for a movie of particles flowing through a 50 um wide tube. The pump rate for this experiment is 1.2 uL/hour or 10 mL/year. Chaining and plug flow have been observed in these experiments. |
| When we flow particles through a small glass tube, we find that there are more particles in the center of the tube than near the sides of the tube. Why is this? (The particles shown are 2 microns in diameter, and from left to right the flow speeds for the fastest particles are 120 microns/s, 250 microns/s, 500 microns/s, and 1000 microns/s). |

|
| This is due to two simple features of the flow. First, when particles flow through our tube, the velocity profile looks like a parabola (which is expected by simple theory). Fluid at the wall doesn't move (due to friction), and fluid moves quite quickly in the center of the tube. This is called a Poiseuille velocity profile, after Jean Poiseuille who studied the flow of blood. |
|
If particles jostle each other when they pass by each other, this happens more often when particles pass each other more frequently. Where does this happen the most? Near the edges of the tube, which is where the flow speed changes the most (from zero on up). Near the center of the tube, the flow is the fastest, but it is also roughly the same for all particles near the center. So, near the edges particles are jostling each other, which moves them into the slower flow sometimes (closer to the wall), and into the faster flow sometimes (closer to the center). If they stay near the wall, they keep getting jostled. If they move toward the center, they get jostled less, and thus are more likely to just stay there. This is all known as shear-induced particle migration.
| Thus, particles bump around until they end up closer to the center. That's the explanation for what we see in the picture above. The reason that all of the particles aren't in the center is because of Brownian motion: random motion of the particles just because they are in a fluid and aren't at zero temperature. Click here to see a small movie showing 4 s of Brownian motion of half micron diameter particles moving in water. At slow flow speeds, the Brownian motion tends to make the particles spread out evenly. At faster flow speeds, the jostling effect makes the particles tend toward the center. |
 Movie of Brownian motion. |
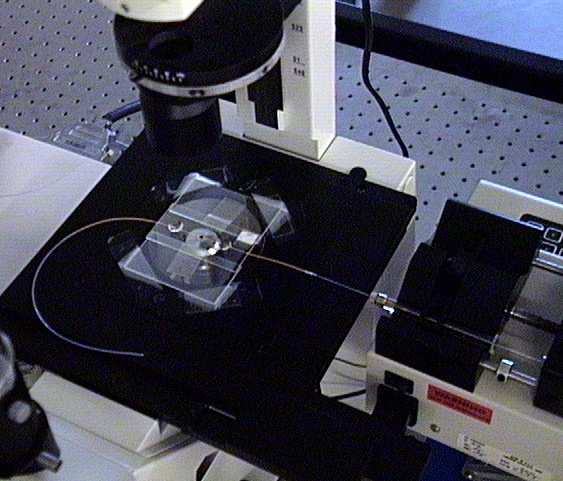
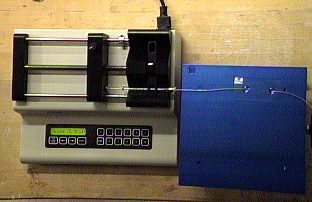
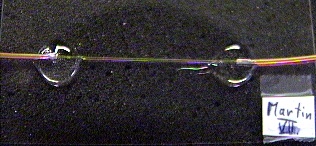
To see the flow, we constructed the apparatus seen above, which uses a syringe pump (below left) to push colloids through the flow chamber (below right).