Eric Weeks
- personal pages - research
- time series analysis
My Adventures in Chaotic Time Series Analysis |
weeks@physics.emory.edu |
Eric Weeks
- personal pages - research
- time series analysis
My Adventures in Chaotic Time Series Analysis |
weeks@physics.emory.edu |
A0. Links and related information
For an explanation of what these pages are all about, select topic 1 above.
This page: top | lorenz | rossler | henon | expt: periodic | qperiodic-2 | qperiodic-3 | chaotic | bottom
![]()
What am I trying to do?
Basically, if it is possible to examine the time series and show that it obeys some sort of deterministic map, you have shown something interesting (that the data is not purely random). If you examine the map, it is sometimes possible to determine that the data are chaotic. The two features to look for are stretching and folding. Stretching means that some portion of the attractor is mapped to a larger portion. Two points nearby each other are mapped farther from each other. Folding means that two portions of the attractor are mapped onto the same region; the map is not invertible.
This will be clearer below with some of the results.
I have a program called minmax which I use to find local minima and maxima in the data.Click here for information about this program.
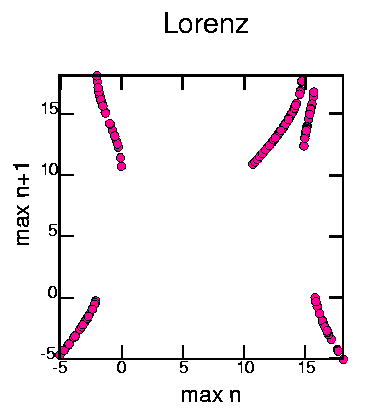
This was generated with the commands: cat lorenz.dat | minmax -pm | awk '{print $2}' | poincare -om2 | psdraw -S 10 10 -A -a "max n" -b "max n+1" -T "Lorenz" -c0.15 -f 255 0 153 > maplor.ps
This map was created by examining successive maxima in the time series. The horizonal axis shows a maximum value, and the vertical axis shows the next maximum which occured. The existence of structure in the map shows that it is deterministic.
There are two regions that can be seen, roughly -5 < x < 0 and 10 < x < 18. Each single region gets mapped onto both regions.
Looking in more detail, 5 regions can be distinguished:
region A: -5 < x < -2
region B: -2 < x < 0
region C: 10 < x < 15
region D: 15 < x < 15.8
region E: 15.8 < x < 18
The regions are mapped A--> AB, B--> CDE, C--> CDE, D--> CDE,
E--> AB.
The folding occurs as regions BCD all map onto the same area
(regions CDE) and regions AE both map onto the same
area (regions AB). The stretching can be seen as the various
portions of the map have steep slopes, larger than 1 in magnitude.
Near x=10 there does not appear to be much stretching, for example,
but in region D there's a lot of stretching.
All of this is fairly nice evidence that the Lorenz attractor is chaotic. This is similar to how Lorenz first proved the attractor was chaotic, I believe, except that he was examining the z time series rather than the x time series as I'm doing.
Thanks to Steve VanHook for reminding me of this method.
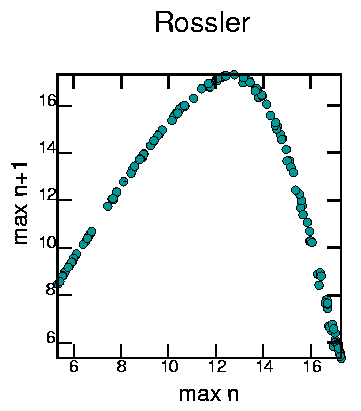
This was made with:
cat rossler.dat | minmax -pm | field 2 | poincare -om2 | psdraw -S 10 10 -A -a "max n" -b "max n+1" -T "Rossler" -c0.15 -f 0 153 153 > mapross.ps
Lots of stretching, mainly for x > 13. Folding as for x > 8 the map has two inverses. Thus, the Rossler attractor is also chaotic.
This page:
top |
lorenz |
rossler |
henon |
expt: periodic |
qperiodic-2 |
qperiodic-3 |
chaotic |
bottom
Hénon:
time series
|
power spectrum
|
mutual information
|
attractor
|
attractor 3D
|
autocorrelation
|
poincare
|
1-D maps
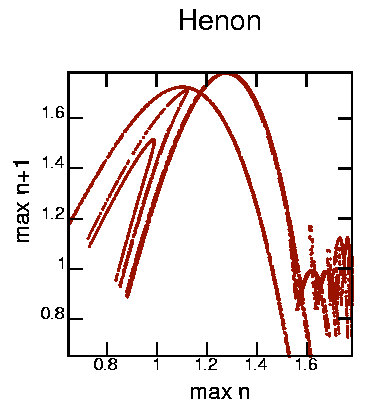
This was produced with the command: cat henon.dat | minmax -m | poincare -om2 | psdraw -S 10 10 -A -a "max n" -b "max n+1" -T "Henon" -Oc0.05 -f 153 20 0 > maphen1.ps
Well, I didn't expect to see much here, but I was curious what it would look like. As the Henon map is a 2-D map, it is not suprising that trying to represent it as a 1-D map looks messy.
This page:
top |
lorenz |
rossler |
henon |
expt: periodic |
qperiodic-2 |
qperiodic-3 |
chaotic |
bottom
Experimental/periodic:
time series
|
power spectrum
|
mutual information
|
attractor
|
attractor 3D
|
autocorrelation
|
poincare
|
1-D maps
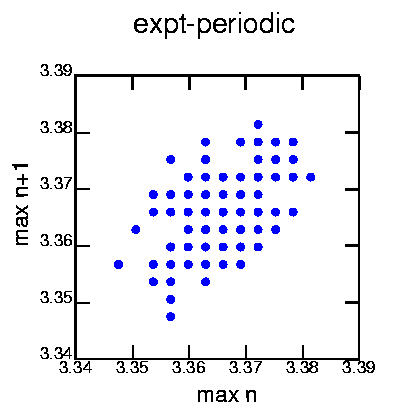
Generated with the commands:
cat exptper.dat | minmax -mw 3 | poincare -om2 | psdraw -X 3.34 3.39 3.34 3.39 -S 10 10 -A -a "max n" -b "max n+1" -T "expt-periodic" -Oc0.15 -f 0 0 255 > mapper1.ps
No suprise here. Successive maxima map onto each other. The discrete points are due to the discretization of the data.
This page:
top |
lorenz |
rossler |
henon |
expt: periodic |
qperiodic-2 |
qperiodic-3 |
chaotic |
bottom
Experimental/quasiperiodic-2:
time series
|
power spectrum
|
mutual information
|
attractor
|
attractor 3D
|
autocorrelation
|
poincare
|
1-D maps
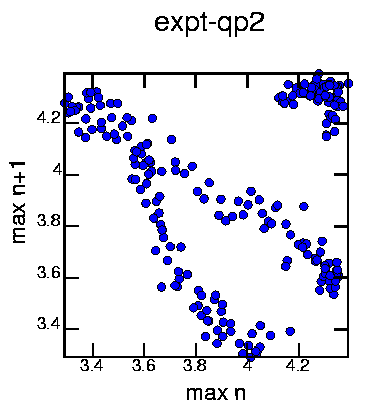
Generated with the commands:
cat exptqp2.dat | minmax -mw 10 | poincare -om2 | psdraw -S 10 10 -A -a "max n" -b "max n+1" -T "expt-qp2" -c0.15 -f 0 0 255 > mapqp2a.ps
Looks deterministic (with noise), but appears that we can't represent it as a 1-D map. At least, not this particular way.
This page:
top |
lorenz |
rossler |
henon |
expt: periodic |
qperiodic-2 |
qperiodic-3 |
chaotic |
bottom
Experimental/quasiperiodic-3:
time series
|
power spectrum
|
mutual information
|
attractor
|
attractor 3D
|
autocorrelation
|
poincare
|
1-D maps
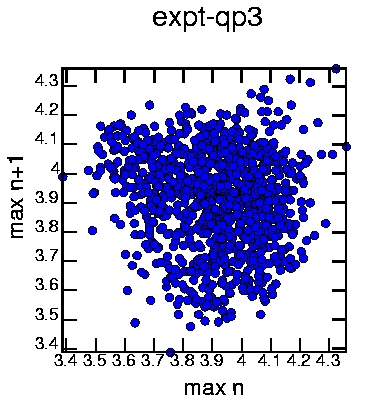
Generated with the commands:
cat exptqp3.dat | minmax -mw 10 | poincare -om2 | psdraw -S 10 10 -A -a "max n" -b "max n+1" -T "expt-qp3" -c0.15 -f 0 0 255 > mapqp3a.ps No structure that I can see...
This page:
top |
lorenz |
rossler |
henon |
expt: periodic |
qperiodic-2 |
qperiodic-3 |
chaotic |
bottom
Experimental/chaotic:
time series
|
power spectrum
|
mutual information
|
attractor
|
attractor 3D
|
autocorrelation
|
poincare
|
1-D maps
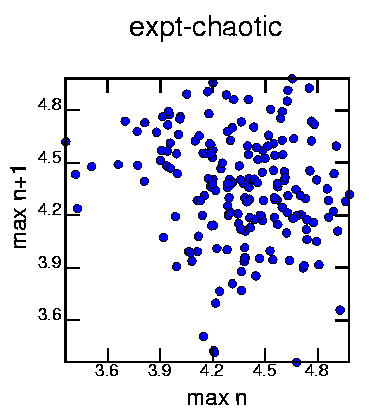
Generated with the commands:
cat exptchao.dat | minmax -mw 5 | poincare -om2 | psdraw -S 10 10 -A -a "max n" -b "max n+1" -T "expt-chaotic" -c0.15 -f 0 0 255 > mapcha1.ps Again, no structure that I can see. As this time series is sampled at a faster rate than the qp-3 time series, there are less maxima and thus this graph shows fewer points than the above qp-3 graph.
So far the analysis has given me several different times. From the Fourier transform I have certain characteristic periods. From the mutual information calculation I have the first minimum. I also have the autocorrelation first zero-crossing.
Note that all times are in natural units (seconds for experimental data, iterations for Hénon map, the time step of the equations for the Rössler and Lorenz systems). Links in the table will take you to the appropriate location where the information was found.
![]()
 Previous page: Poincare sections
 Next page: Nothing, yet. Something, soon. Fractal dimension?
This page: top | lorenz | rossler | henon | expt: periodic | qperiodic-2 | qperiodic-3 | chaotic | bottom
![]()