Eric Weeks
- personal pages - picturesCellular Automata Phase Diagram |
weeks@physics.emory.edu |
Eric Weeks
- personal pages - picturesCellular Automata Phase Diagram |
weeks@physics.emory.edu |
![]()
For this plot, D ranges from -1 to 1 (horizonal axis), A = C and range from -1 to 1 (vertical axis; -1 at top of the plot), and B=0.2 is fixed. In this plot, black is zero, white is 1/2. Given that the arithmetic of the rule is done mod 1, the plot is periodic in D.
Click here, or click the picture, to return to the previous page.
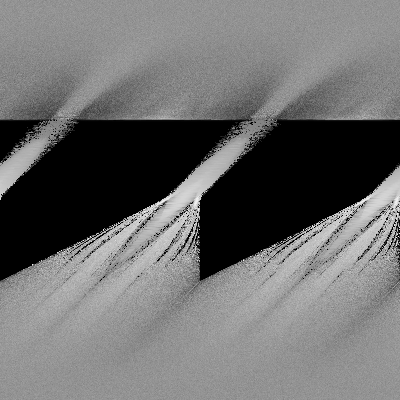
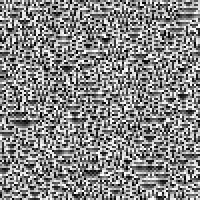
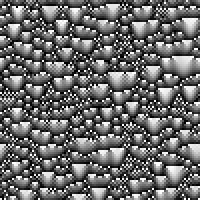
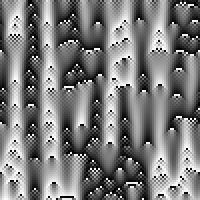
Here is a sequence of pictures with D=0, B=0.2. In these pictures A = C = 0.395, 0.40, 0.41, 0.42, 0.45. For values of C less than 0.4, the final state tends towards zero (black) as A+B+C is less than 1.0. For C=0.4, the final state is the average of all of the initial states, mostly. For C greater than 0.4, the CA never reaches an equilibrium. Instead, for A+B+C slightly greater than one, cells quickly reach the average value of their neighbors. However, the average state of cells keeps increasing, and eventually a cell "overflows" and gets set back to zero (since the math is done mod 1). In some cases, large amounts of neighboring cells all overflow simultaneously; however, in some cases, they do not overflow, causing the streaked appearance. This CA has been called a "dripping rail" analogous to water dripping off a horizonal rail; every once in a while the water piles enough to release a drop, in some cases releasing a local "avalanche" of drops.


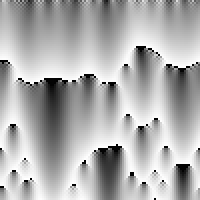
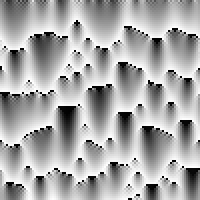
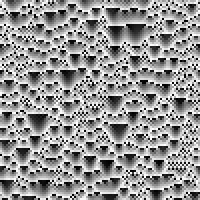
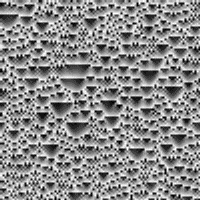
Here is a sequence of pictures with B=0.2, A = C = 0.5. In these cases D takes on the values -0.4, -0.2, -0.1, 0.0, 0.2
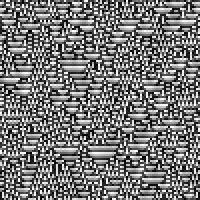
Note that when D=-0.1, there appears to be some sort of boundary
between two types of behavior.
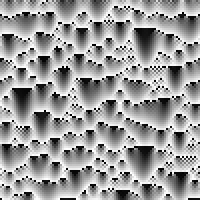
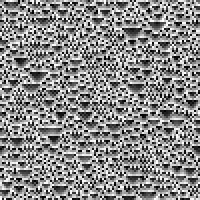
Click here, or on the pictures below, to see detailed behavior at this
boundary. Warning! 360k of gif's!


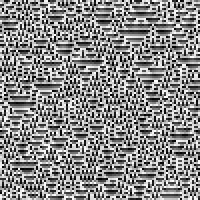
The three pictures above are D=-0.11, -0.10, -0.09. (A=C=0.5, B=0.2)
![]()
 Click here for information about the software I use to make cellular
automata.
Click here for information about the software I use to make cellular
automata.