Note that this program depends on calling the program avgstd. Avgbin updated 11-18-07 (added an error check by Gianguido Cianci), previously updated 4-22-07 (improved by Scott Franklin to run much faster).
Sometimes I want to find the average of one quantity as a function of another quantity. For example, I downloaded some data on heights and weights of children (link now gone). I made a text file containing data from girls only. The first column is age in months, the second is height in inches, and the third is weight in pounds. Thus:
IDL> help,ahw
AHW FLOAT = Array[3, 111]
Suppose I want to find the average weight, as a function of height. I can do this with the following procedure:
IDL> av = avgbin(ahw(1,*),ahw(2,*),binsize=2)
IDL> plot,ahw(1,*),ahw(2,*),psym=4,/ynozero,charsize=2
IDL> oplot,av(0,*),av(1,*),thick=2
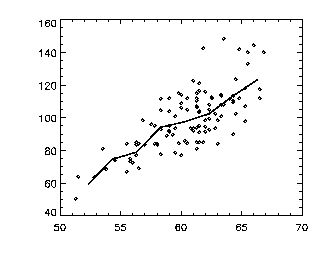
This makes the following plot:

The symbols are individual data points (height,weight) and the solid line is the average weight as a function of height. The same thing can also be done as: by:
IDL> av = avgbin(ahw(1:2,*),binsize=2)
That is, if only one array is given, avgbin assumes that the first two columns are to be compared.
INPUT: Data in two columns, call them x and y.
Can be in separate variables or in one variable as just
discussed.
OUTPUT: The program returns an array that is 7
columns by 101 rows (the default number of rows). The columns
are x, average y, standard deviation y, min y, max y, number of y,
median y. The data are all as a function of x, so for example
the number of y values per x is the same thing as the histogram.
You'll notice in the example above I used the keyword BINSIZE. This forces the binsize to have a certain value, which will then result in a different number of bins (rather than the default value of 101). You could imagine doing this as well:
IDL> av=avgbin(avh(1,*),avh(2,*))
IDL> w=where(av(5,*) gt 0)
IDL> plot,av(0,w),av(1,w),/ynozero,psym=4
This plots only elements of av that have data in them, in other words, where the "number of y" is larger than zero.
If you want to get slightly fancier, you can use the /MORE keyword, which then adds the skewness and kurtosis as two final columns.
Often I want to use the standard deviation to make error bars, and since avgbin gives you the standard deviation for free, I wrote this program. The quick usage is below left, and the fancier versions are to connect the dots (/CONNECT) and to add in little horizontal bars of length given by the BARS keyword, as shown at right. THese plots both show the average height (in inches) as a function of age (in months).
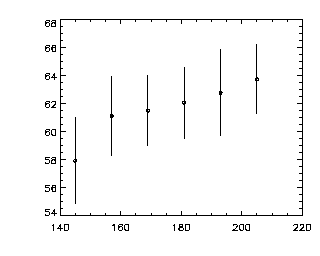 IDL> av = avgbin(ahw(0:1,*),binsize=12) IDL> stddevplot,av,chars=2 |
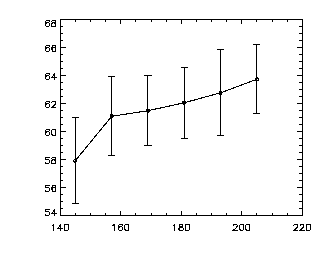 IDL> av = avgbin(ahw(0:1,*),binsize=12) IDL> stddevplot,av,chars=2,/connect,bars=1.0 |
If you have need to, you can use the /INVERT keyword, which produces a plot showing the average height on the horizontal axis against the age on the vertical scale.
IDL> av = avgbin(ahw(0:1,*),binsize=2)
IDL> stddevplot,av,chars=2,/connect,/invert,/ynozero
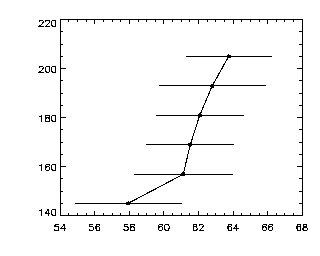
Note that stddevplot can take extra keywords and pass them on to PLOT, which includes commands for axis labels, etc.
What you want to do is get a bunch of arrays in one-to-one correspondence with each other. For example, I like to analyze the motions of particles. I have a big list of particles at various times. If I can characterize these particles with other programs, that's great. Often I can get arrays that have information such as how far each particle moves in a given time; the local volume a particle has; the number of neighbors a particle has; etc. Then I can look for correlations between any of these variables using avgbin. Thus, I can plot:
|
IDL> w = where(ahw(0,*)/12 gt 12 and ahw(0,*)/12 lt 16) IDL> av=avgbin(ahw(1,w),ahw(2,w),binsize=1.0/3.0) IDL> stddevplot,av IDL> stddevplot,av,chars=2 |
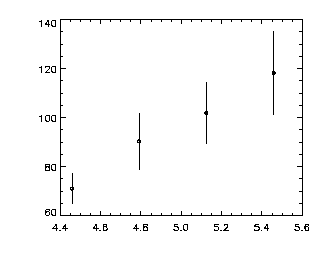 |
These two programs were written by Eric.