Particle tracking using IDL -- John C. Crocker and
Eric R. Weeks
Home |
Download software |
Tutorial |
Extra software
Extra g(r) routines
Consider these as unsupported programs, but you may find them
useful. Not that we really provide "support" for any of our
programs, but these in particular may be of limited interest.
(click here if that link fails)
Usage:
IDL> grwrap, 'trackfiles*', dim=2, /track
or
IDL> grwrap, 'pretrackfiles*', dim=2
This calculates g(r) for a bunch of files, and saves the
data with filenames with the prefix "gr." on the front. If you
want to change the prefix, you can use the prefix keyword:
IDL> grwrap, 'files*', prefix='pair.'
(for example). If you want to run ericgr2d (or ericgr3d) with
extra options, you can provide the options:
IDL> grwrap, 'pretrackfiles*', dim=2, deltar=0.1,
rmax=5.0
Note that the default is dim=3 (use ericgr3d),
you have to use dim=2 to have the routine use
ericgr2d.
(download here, if those links fail)
Usage:
IDL> grdatwrap, 'gr.*', data
This is a kludgy program that goes through a bunch of g(r) files
and tries to determine the location of the first peak. In the
variable "data" is returned (r_peak, full width half max,
height). Also this information is printed to the screen, along
with the filename. The circ function is
included as it is called by grdatwrap. It sets the user-defined
symbol (plot symbol 8) to a circle.
Additionally, the program makes a nice plot for each g(r) file,
that indicates where the peak position is:
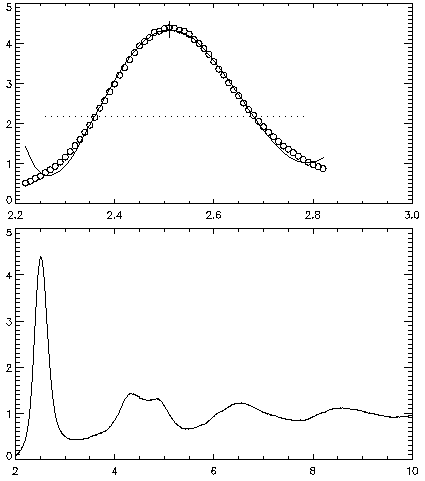
The top plot shows the g(r) data (circles), curve fit (solid
line), peak position (vertical line), and half maximum (dotted
line). The bottom plot shows the full g(r). You can see that
the curve fit isn't great far from the peak, since it's a 6th
order polynomial it certainly can do funny things. However this
seems to provide something that is reproducible and which my
eye likes best for its ability to fit the data at the peak.
WARNINGS:
- The program assumes that spacing between adjacent r values is 0.01
- The program assumes certain things about the width of
the peak, which determines how many points are used for the
polynomial fit
- I make no guarantees that this program will work with your
data, if your data look much different than mine.
|
- What is the pair correlation function?
- How to calculate g(r)
- IDL routines to calculate g(r)
- Extra g(r) routines
(you are here)
Contact us
- This page was written by
Eric Weeks:
weeks(at)physics.emory.edu