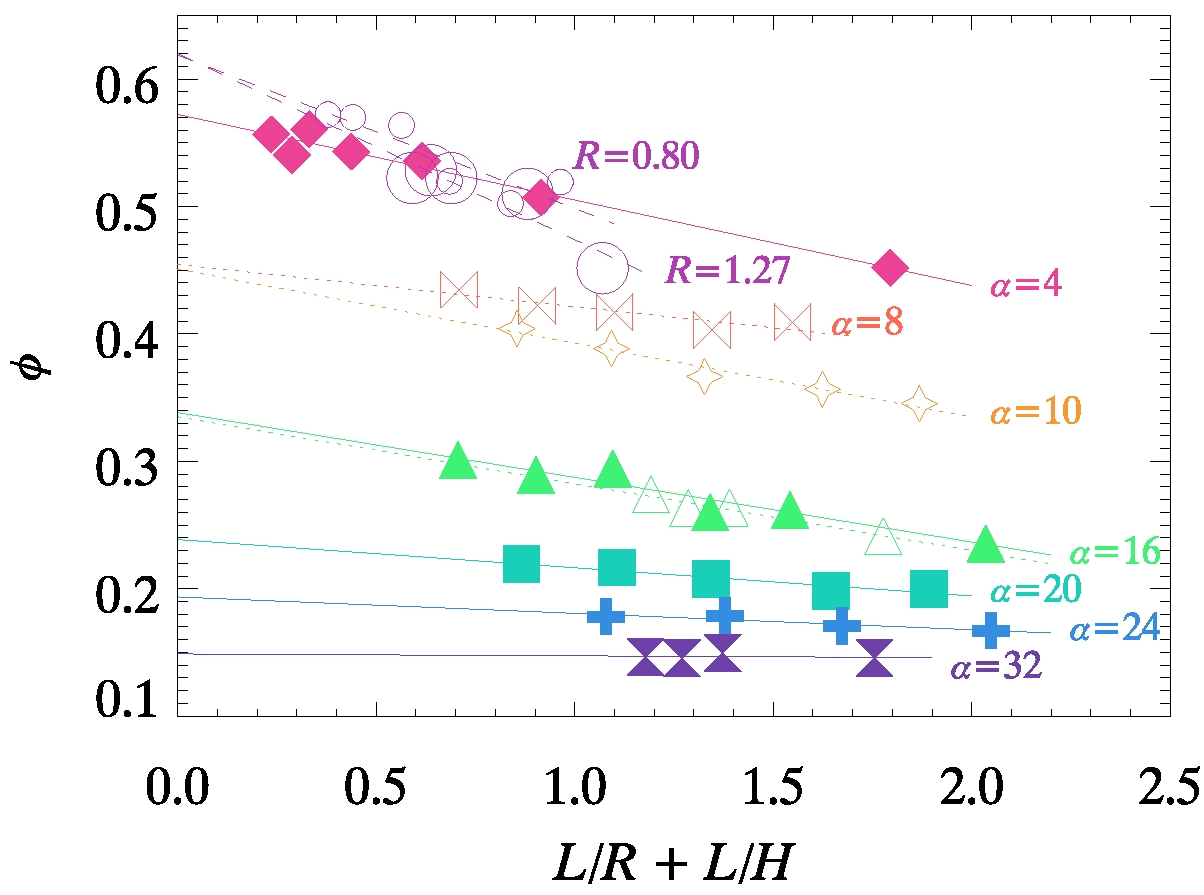
I tend to make IDL scripts to produce plots. At the top of the script I put this:
sp,1
device,file='acsaging.ps'
device,/color
loadct,76,file='~/ericcol.tbl'
device,set_font='Times',/tt_font
The key line is the "loadct" command which loads this file: ericcol.tbl. I made a custom color palette based on the "cubehelix less-angry rainbow". It is saved as palette #76 in the color table file. This then lets you use colors 0-255 in plotting to refer to the colors in the color table. For example:
x=findgen(100)
plot,x,cos(x),/nodata
oplot,x,cos(x),color=42
oplot,x,sin(x),color=216
The 'plot' command will make a black graph. I used /nodata so that no data would be plotted in black; I want to plot the data in other colors. The two oplot commands plot the cosine and sine in red and dark blue, respectively. Here are some useful colors in this color table:
| 21 | reddish purple |
| 42 | red |
| 160 | green |
| 187 | light blue-green |
| 216 | dark blue |
| 255 | dark purple |
At the end of the IDL script making the figure, put:
device,/close
sp,3
Note that you can use the built-in IDL command XLOADCT to examine all the default color tables. #3 "red temperature" is the one that's often used for AFM plots, for example (that goes from black --> dark red --> red --> orange --> white). To use that color table, you could do:
loadct,3
where now you don't have to specify a file, you're just loading in one of the default color tables that IDL has built-in.
Use the MODIFYCT command. For example:
bw=findgen(256)
col=bw2rgb3(bw)
col=col*0.8
col(*,0)=0
modifyct,77,'darker rainbow w/ black',col(0,*),col(1,*),col(2,*),$
   file='ericcol.tbl'
using bw2rgb3.pro which transforms black & white values into the "cubehelix less-angry rainbox" that was mentioned above. Look at the MODIFYCT documentation for more information.
And this, then, is how you can get arbitary colors for your plot. Figure out the red/green/blue values you want for each color. Make an array with these values, and then use MODIFYCT to store that array as a custom color table in your own color table file. Then read in that file using LOADCT when you make your graph.
