Eric Weeks
- personal pages - picturesSanta Fe CSSS95 Picture #3 |
weeks@physics.emory.edu |
Eric Weeks
- personal pages - picturesSanta Fe CSSS95 Picture #3 |
weeks@physics.emory.edu |
![]()

![]()
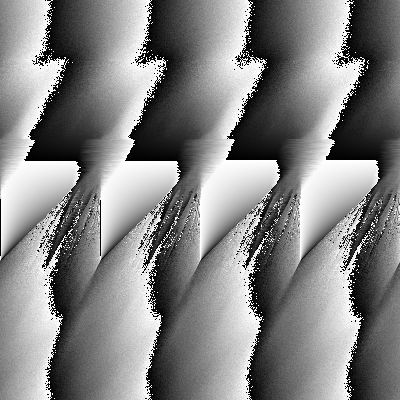
I was curious what CA rules would be "interesting". I decided one criteria would be what the average cell color would be after the CA had evolved for a while. I had found earlier that some CA rules would end with the final state having all of the cells be the same color, the color of the constant that was added on each step. As it turns out, this is not necessarily the best critieria to use to identify "interesting" CA's, but it's the criteria which made the most interesting "phase space portrait," which is what Picture #3 is. The update rule for the CA's was taken to be:
a_n(T+1) = alpha * a_n(T) + 0.2 *(a_(n-1)(T) + a_(n+1)(T)) + gamma
The picture shown ranged from (gamma=-2.0,alpha=-2.0) in the upper left corner to (2.0,2.0) at the lower right corner. The value plotted at each point is the average value of a_n for the 200th generation of a 200-cell 1-D CA, minus the value of gamma for that CA rule. (This explanation is sketch so if you have more detailed questions ask me.) The CA's start with random initial conditions, leading to the random appearanace of some of thes sections of the plot.
If you have questions send me email, email address below.
![]()