Eric Weeks
- personal pages - research
- time series analysis
My Adventures in Chaotic Time Series Analysis |
weeks@physics.emory.edu |
Eric Weeks
- personal pages - research
- time series analysis
My Adventures in Chaotic Time Series Analysis |
weeks@physics.emory.edu |
A0. Links and related information
For an explanation of what these pages are all about, select topic 1 above.
This page: top | lorenz | rossler | henon | expt: periodic | qperiodic-2 | qperiodic-3 | chaotic | bottom
![]()
This is a side project of mine, learning more about chaotic time
series analysis. My motivation is that I have some time series
from my
experiment
which I would like to analyze. I think some of them are
chaotic, whereas others are clearly periodic.
I'll add to this web page as I have time and as I try different things.
My hope is to link to whatever software I use and/or provide source code
if necessary. For example,
you can
download the software that I used to make the graphs on this page.
![]()
I have seven time series. You can download them in several forms:
timeser.zip: pkzip format; on UNIX systems, use unzip (303k)
timeser.tar.gz: use tar -zxvf to extract (305k)
timeser.tar.Z: use tar -Zxvf to extract (328k)
Each time series is an ASCII file.
![]()
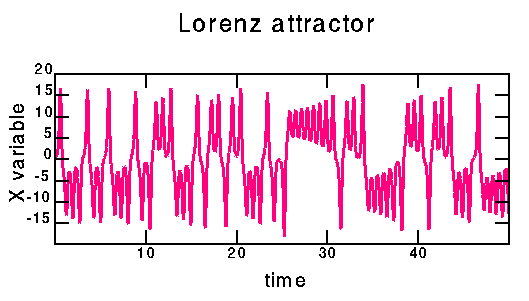
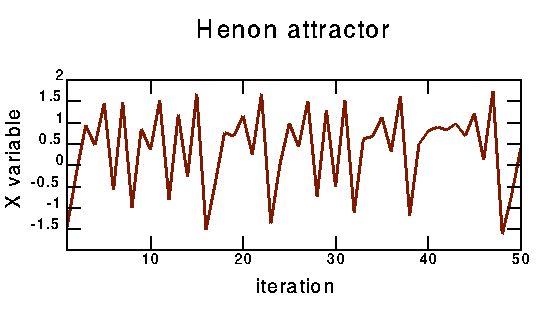
To start with, I have three sets of data which I know are chaotic and for which I can probably look up information about.
![]()
This was created by Runge-Kutta integration of
the Lorenz equations. I used the subroutine rkdumb() taken from
Numerical Recipes, with a step size of 0.01. The Lorenz equations
are given by:
dx/dt = sigma * (y - x)
dy/dt = r * x - y - x * z
dz/dt = x * y - b * z
I use the standard values sigma=10.0, r = 28.0, b = 8/3.
![]()
This was created by Runge-Kutta integration of
the Rossler equations. I used the subroutine rkdumb() taken from
Numerical Recipes, with a step size of 0.01. The Rössler equations
are given by:
dx/dt = -z - y
dy/dt = x + a * y
dz/dt = b + z * (x - c)
I use the standard values a=0.15, b=0.20, c=10.0.
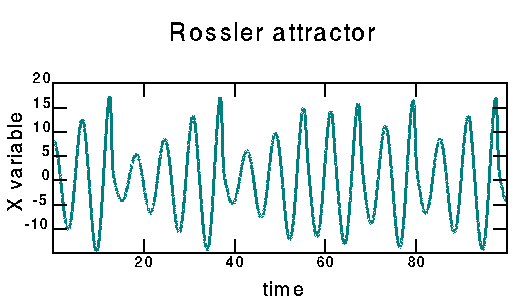
This was first proposed in the article: O. E. Rössler, Phys. Lett. 57A, 397 (1976).
![]()
This page:
top |
lorenz |
rossler |
henon |
expt: periodic |
qperiodic-2 |
qperiodic-3 |
chaotic |
bottom
Hénon:
time series |
power spectrum
|
mutual information
|
attractor
|
attractor 3D
|
autocorrelation
|
poincare
|
1-D maps
The Hénon map is given by:
x' = a + b * y - x^2
y' = x
I use a=1.4, b=0.3. I generated the map with the following command:
gawk 'BEGIN {x=1;y=1;for (t=1;t < 26384;t++)
{xx=1.4+0.3*y-x*x;y=x;x=xx;print x}}' | tail -16384
The map was suggested in the article "A two-dimensional mapping with a strange attractor," M. Hénon, Commun. Math. Phys. 50, 69-77 (1976).
![]()
This page:
top |
lorenz |
rossler |
henon |
expt: periodic |
qperiodic-2 |
qperiodic-3 |
chaotic |
bottom
Experimental/periodic:
time series |
power spectrum
|
mutual information
|
attractor
|
attractor 3D
|
autocorrelation
|
poincare
|
1-D maps
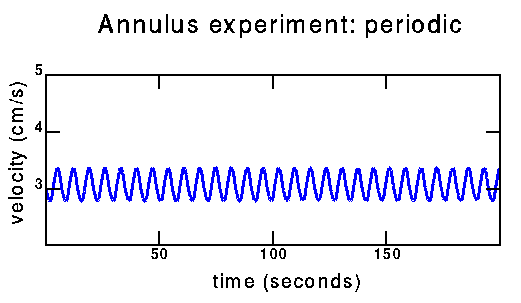
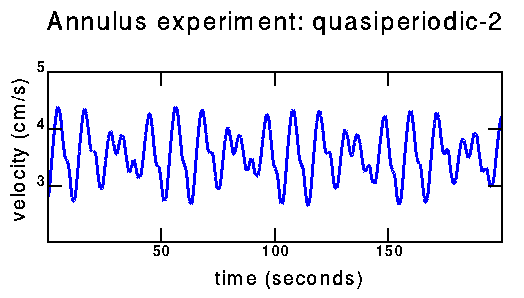
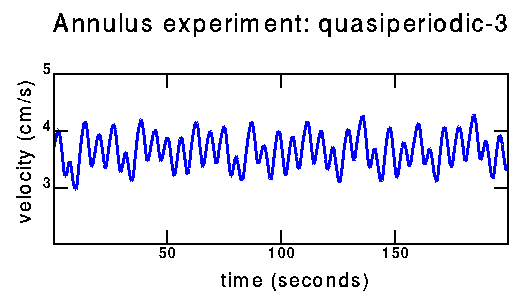
Time series taken from my experiment. For more information on the experimental setup, see my research page. These are velocity time series taken with a hot film probe in my experiment. If you'd like more information email me.
![]()
This page:
top |
lorenz |
rossler |
henon |
expt: periodic |
qperiodic-2 |
qperiodic-3 |
chaotic |
bottom
Experimental/quasiperiodic-2:
time series |
power spectrum
|
mutual information
|
attractor
|
attractor 3D
|
autocorrelation
|
poincare
|
1-D maps
![]()
This page:
top |
lorenz |
rossler |
henon |
expt: periodic |
qperiodic-2 |
qperiodic-3 |
chaotic |
bottom
Experimental/quasiperiodic-3:
time series |
power spectrum
|
mutual information
|
attractor
|
attractor 3D
|
autocorrelation
|
poincare
|
1-D maps
![]()
This page:
top |
lorenz |
rossler |
henon |
expt: periodic |
qperiodic-2 |
qperiodic-3 |
chaotic |
bottom
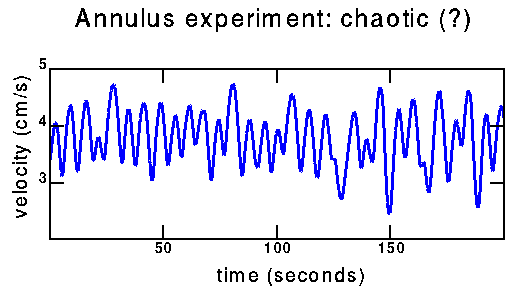
Experimental/chaotic:
time series |
power spectrum
|
mutual information
|
attractor
|
attractor 3D
|
autocorrelation
|
poincare
|
1-D maps
How can I tell the difference between the above data (quasiperiodic with three fundamental frequencies) and the data below (possibly chaotic)? From the power spectra; this will be on the next page. Also hopefully from trying to reconstruct a strange attractor from the chaotic data. To some extent, distinguishing these two time series is why I am working on this project.
![]()
 The easiest thing to do next is to take the Fourier transform
of each data set.
The easiest thing to do next is to take the Fourier transform
of each data set.
This page: top | lorenz | rossler | henon | expt: periodic | qperiodic-2 | qperiodic-3 | chaotic | bottom
![]()