Using confocal microscopy, we watch the motion of colloidal particles as they mimic the behavior of a glassy substance. You can learn more about our methods here.
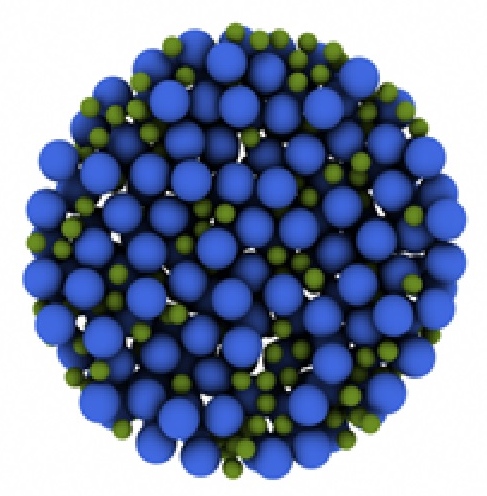
The image on the right is a rendering of actual particles forming a colloidal glass. The orange particles represent those who are moving faster, while the smaller green ones are moving much slower. Notice how the particles that are moving do so together, in organized clusters. In our confinement experiments, we observe what would happen if our colloidal sample is confined to a volume that is similar in size to a cluster.
(move your mouse over the picture)
We use colloids, or microscopic plastic beads suspended in a fluid with the same density and index of refraction, to simulate atomic behavior on a scale that we can optically see in a microscope. If the beads occupy roughly 58% of our sample's volume then the sample actually accurately mimics the behavior of the atoms in a glass. So if we decrease the concentration of beads, letting the sample move more freely as a liquid, then this is analogous to melting a block of glass.
We have found that the motion of our particles are slower when confined, thus producing glassy behavior in a sample that would otherwise be a liquid in an unconfined geometry. In a way, we're controlling or triggering the glass transition by confining our samples to smaller volumes.
Here are a few examples of specific results:
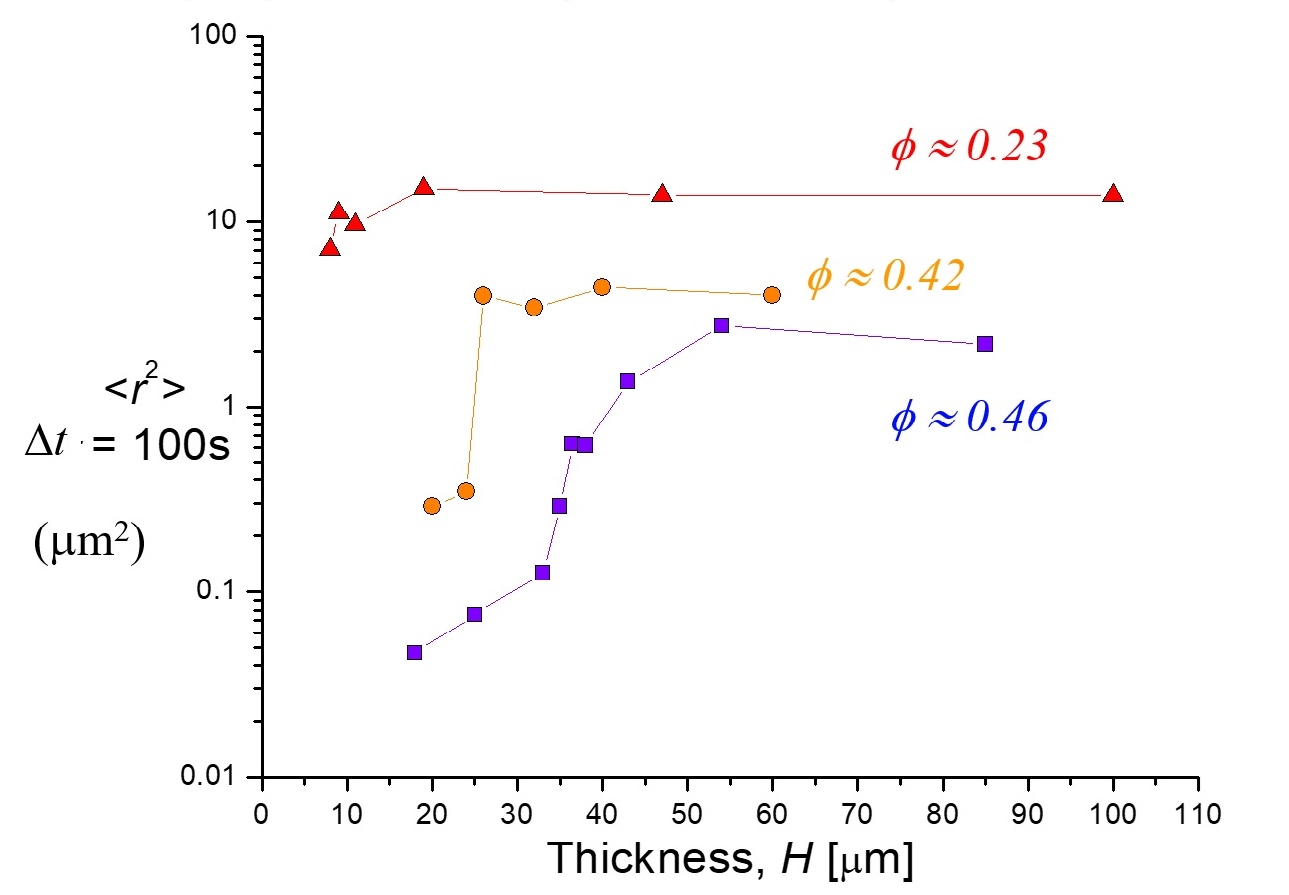 Confinement between parallel plates -- see 2007 PRL paper by Carrie Nugent. Key finding: particle motion slows dramatically when confined between a narrower gap. The onset of this effect identifies a length scale for confinement effects. Moreover, this length scale grows (from about 25 microns to about 50 microns) when the volume fraction is increased. On the right side of this graph, the decrease in the plateau height shows the slowing of the unconfined sample due to the increase in volume fraction phi -- that is, the regular approach of the glass transition. |
 Confinement in droplets -- see 2014 paper by Gary Hunter. Key finding: changing the viscosity of the liquid outside the droplets changes the mobility of the particles within the droplets. Shows that the confinement-induced slowing is due to the interface. |
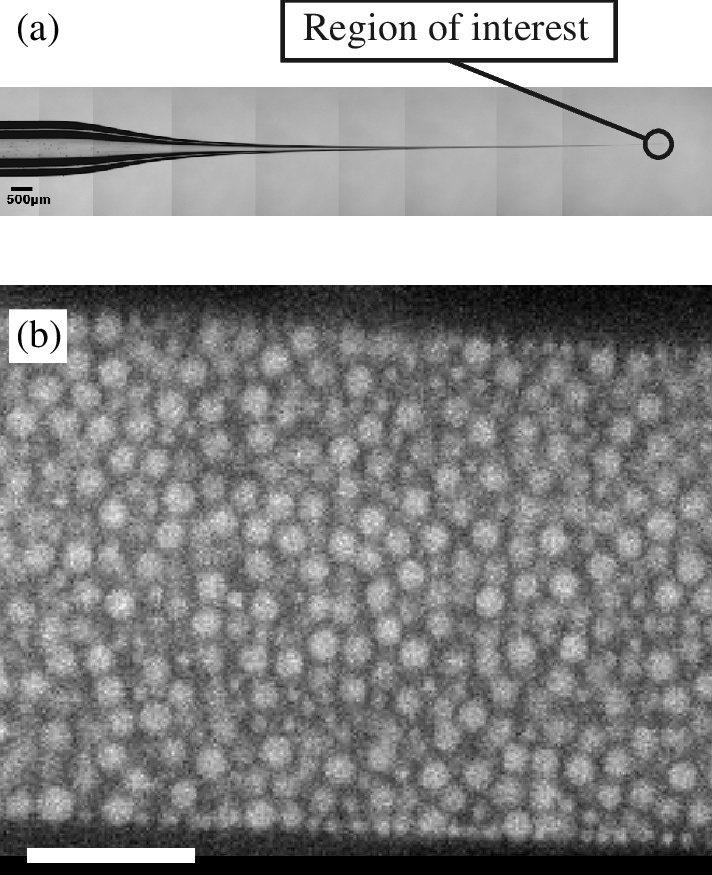 Cylindrical confinement -- see 2013 paper by Nabiha Saklayen. Key finding: particles move substantially slower near walls, with a gradient in mobility near the walls. |
Publications:
- "Colloidal glass transition observed in
confinement"
CR Nugent, KV Edmond, HN Patel, ER Weeks, Phys. Rev. Lett. 99, 025702 (2007). - "Structure of dense colloidal liquids in tight
spaces"
ER Weeks & CR Nugent, Rep. Inst. Fluid Sci. 19, 45-49 (Tohoku Univ., 2007).- Abstract / PDF / volume link
- "Local influence of boundary conditions on a confined
supercooled colloidal liquid"
KV Edmond, CR Nugent, and ER Weeks, Europhys. J. Spec. Topics 189, 83-93 (2010)- Abstract / PDF / arXiv:1003.6117 / journal
- "Influence of confinement on dynamical
heterogeneities in dense
colloidal samples"
KV Edmond, CR Nugent, and ER Weeks, Phys. Rev. E 85, 041401 (2012)- Abstract / PDF / arXiv:1003.0856 / journal
- "Slow dynamics in cylindrically confined colloidal
suspensions"
N Saklayen, GL Hunter, KV Edmond, and ER Weeks, AIP Conf. Proc. 1518, 328-335 (2013).- Abstract / PDF / arXiv:1209.1108 / journal
- "Boundary mobility controls glassiness of confined colloidal liquids"
GL Hunter, KV Edmond, and ER Weeks, Phys. Rev. Lett. 112, 218302 (2014). - "Aging near rough and smooth boundaries in colloidal
glasses"
C Cao, X Huang, CB Roth, & ER Weeks, J. Chem. Phys. 147, 224505 (2017).- Abstract / PDF / arXiv:1708.04867 / journal
- Publicity: Scilight article about our work by Chris Patrick / PDF of Scilight
This webpage was written by Kazem Edmond, with some minor additions later by Eric Weeks. For more information, please contact Eric: <erweeks(at)emory.edu>