Eric Weeks
- personal pages - research
- time series analysis
My Adventures in Chaotic Time Series Analysis |
weeks@physics.emory.edu |
Eric Weeks
- personal pages - research
- time series analysis
My Adventures in Chaotic Time Series Analysis |
weeks@physics.emory.edu |
A0. Links and related information
For an explanation of what these pages are all about, select topic 1 above.
This page: top | lorenz | rossler | henon | expt: periodic | qperiodic-2 | qperiodic-3 | chaotic | bottom
![]()
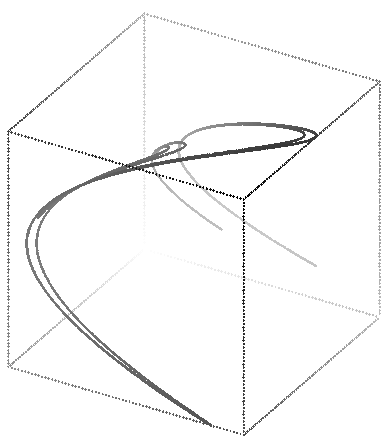
For many of these attractors, they properly should be embedded in three dimensions (or perhaps even more). So, I have crudely attempted to reproduce them in 3-D. This was entirely with homemade crude software.
Brief description of software: I wanted to use my psdraw program to plot the data. In the end I added a little bit of code to psdraw in order to handle this.
![]()
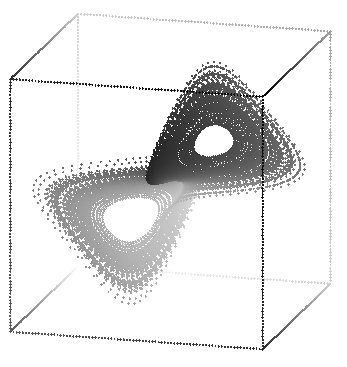
The Lorenz attractor is a strange attractor, a geometrical object with fractal dimension. Sometime later I may try to find the dimension. Note that these views don't look like the "standard" views of the Lorenz attractor, as they are made from delay coordinates rather than the actual system coordinates.
These were generated with the commands: rotate -s 80 -t 15 -p 15 lorenz.3d | sort -n +2 -3 | psdraw -zOc0.04 -X -30 30 -30 30 > atlorr1.ps
rotate -s 80 -t 115 -p 15 lorenz.3d | sort -n +2 -3 | psdraw -zOc0.04 -X -30 30 -30 30 > atlorr2.ps
![]()
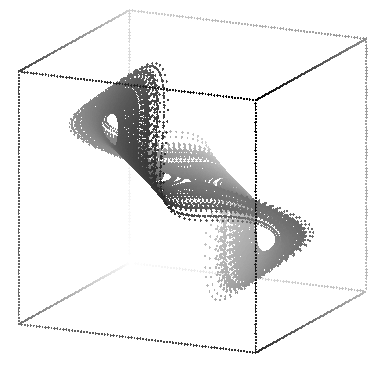
These were made with:
rotate -t 155 -p 40 -s 70 rossler.3d | sort -n +2 -3 |
psdraw -zOc0.04 -X -25 25 -25 25 > atros3d1.ps
rotate -t 170 -p 310 -s 70 rossler.3d | sort -n +2 -3 |
psdraw -zOc0.04 -X -25 25 -25 25 > atros3d2.ps
Recall that the equation describing the Rössler attractor are
3-dimensional.
![]()
This page:
top |
lorenz |
rossler |
henon |
expt: periodic |
qperiodic-2 |
qperiodic-3 |
chaotic |
bottom
Hénon:
time series
|
power spectrum
|
mutual information
|
attractor
|
attractor 3D
|
autocorrelation
|
poincare
|
1-D maps
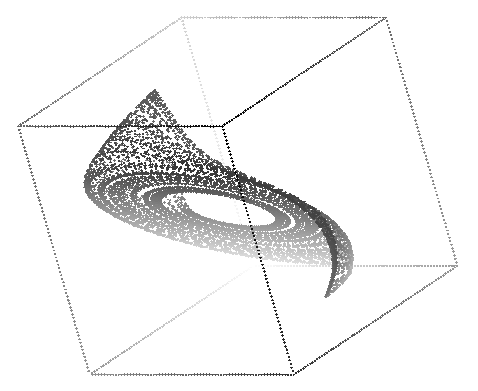
As the map is a 2-D map, the full structure of the Hénon attractor can be seen in a 2-D plot; it does not need to be displayed in 3-D. But, to satisfy my curiosity, I plotted it in 3-D.
This was produced with the command: rotate -s 70 -t 120 -p 30 henon.3d | sort -n +2 -3 | psdraw -zOc 0.04 -X -2.8 2.8 -2.8 2.8 > henon3d.ps
![]()
This page:
top |
lorenz |
rossler |
henon |
expt: periodic |
qperiodic-2 |
qperiodic-3 |
chaotic |
bottom
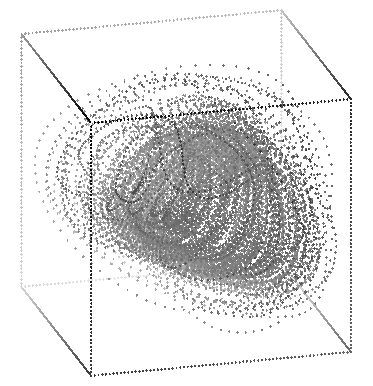
Experimental/periodic:
time series
|
power spectrum
|
mutual information
|
attractor
|
attractor 3D
|
autocorrelation
|
poincare
|
1-D maps
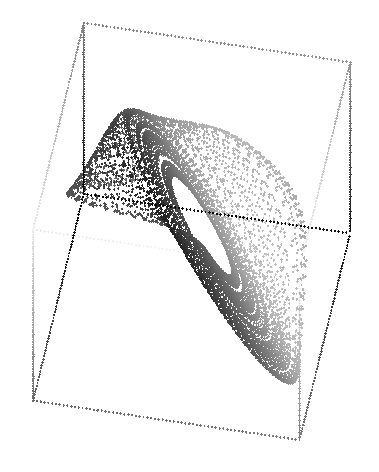
This data can be reasonably displayed in only 2 dimensions, but here is a 3D plot for comparison.
![]()
This page:
top |
lorenz |
rossler |
henon |
expt: periodic |
qperiodic-2 |
qperiodic-3 |
chaotic |
bottom
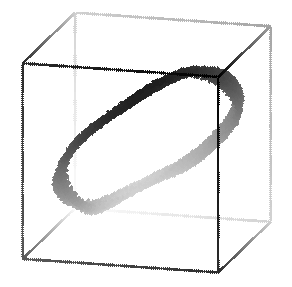
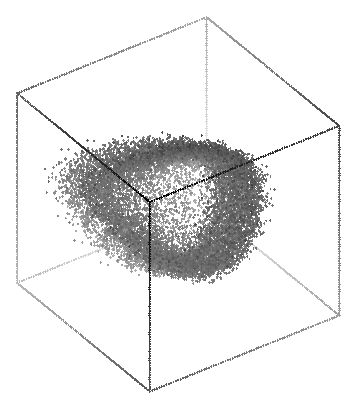
Experimental/quasiperiodic-2:
time series
|
power spectrum
|
mutual information
|
attractor
|
attractor 3D
|
autocorrelation
|
poincare
|
1-D maps
The second picture was made with: rotate -s 70 -t 40 -p -20 -r 180 expqp2.3d | sort -n +2 -3 | psdraw -zOc0.05 -X -1.5 1.5 -1.5 1.5 > atqp2.1.ps
I have made 9 small pictures, which show a gradual change in the point of view of this particular attractor. Click here to see them. (109 k of pictures total)
![]()
This page:
top |
lorenz |
rossler |
henon |
expt: periodic |
qperiodic-2 |
qperiodic-3 |
chaotic |
bottom
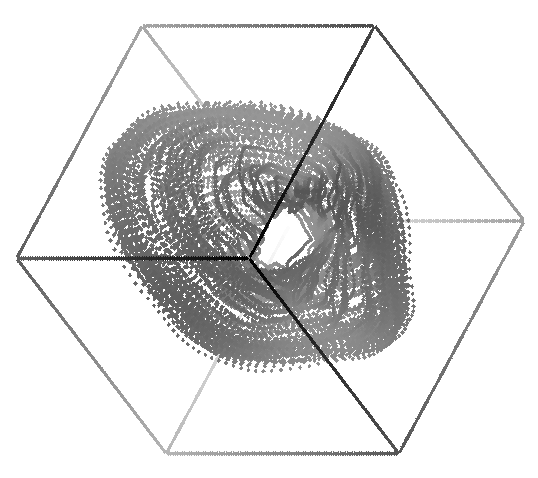
Experimental/quasiperiodic-3:
time series
|
power spectrum
|
mutual information
|
attractor
|
attractor 3D
|
autocorrelation
|
poincare
|
1-D maps
This attractor looks like a tube with a little bit of fuzz inside it. The pictures below show the view looking down the length of the tube, and at the side of the tube. The individual trajectories are harder to see than the other attractors shown on this page, as the data is sampled 4 times slower, so the points don't look as continuous as the other experimental data sets.
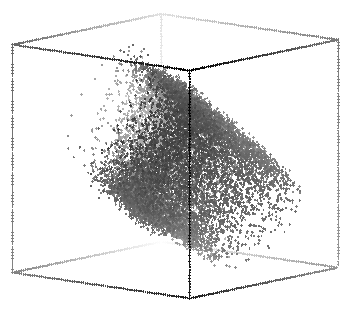
The first was made with the command: rotate -s 80 -t 55 -p 35 exptqp3.3d | sort -n +2 -3 | psdraw -zOc0.04 -X 2.2 5 2.2 5 > pic1.ps
The second was made with the command: rotate -s 80 -t 130 -p 10 exptqp3.3d | sort -n +2 -3 | psdraw -zOc0.04 -X 2.2 5 2.2 5 > pic2.ps
![]()
This page:
top |
lorenz |
rossler |
henon |
expt: periodic |
qperiodic-2 |
qperiodic-3 |
chaotic |
bottom
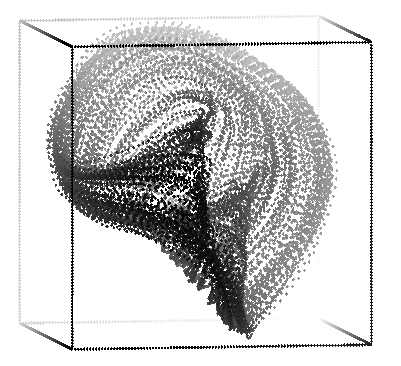
Experimental/chaotic:
time series
|
power spectrum
|
mutual information
|
attractor
|
attractor 3D
|
autocorrelation
|
poincare
|
1-D maps
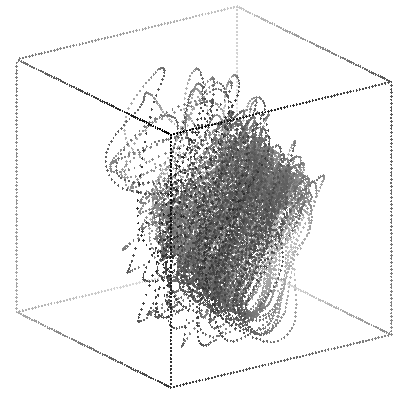
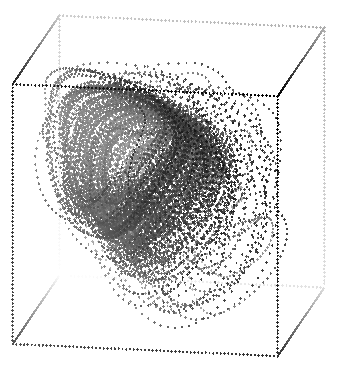
These three pictures were made with the commands:
rotate -s 70 -t 15 -p 200 exptchao.3d | sort -n +2 -3 | psdraw -zOc0.04 -X 1.6 5.7 1.6 5.7 > atchar1.ps
rotate -s 70 -t 125 -p -20 -r 180 exptchao.3d | sort -n +2 -3 | psdraw -zOc0.04 -X 1.6 5.7 1.6 5.7 > atchar2.ps
rotate -s 70 -t 100 -p 15 exptchao.3d | sort -n +2 -3 | psdraw -zOc0.04 -X 1.6 5.7 1.6 5.7 > atchar3.ps
![]()
So far the analysis has given me several different times. From the Fourier transform I have certain characteristic periods. From the mutual information calculation I have the first minimum. Thus, a table:
Note that all times are in natural units (seconds for experimental data, iterations for Hénon map, the time step of the equations for the Rössler and Lorenz systems). Links in the table will take you to the appropriate location where the information was found.
![]()
 Previous page: 2-D plots of strange attractors
 Next page: autocorrelation functions
This page: top | lorenz | rossler | henon | expt: periodic | qperiodic-2 | qperiodic-3 | chaotic | bottom
![]()