I have another page which makes some small explanation of
what Poincare sections are about.
Click here for more information on this method.

 Click here to download software.
To compile, use "cc -o poincare poin.c -lm".
To use the software, you can either specify the filename or pipe the
data into the program:
cat datafile | poincare > poinsec.dat
or
poincare datafile > poinsec.dat
There are several options. -h lists all the options with a brief
comment to remind you what they do.
-h : help -- lists all options
-m # : set the embedding dimension (default = 3)
-t # : set the delay time (default = 1)
-M # : the input is already multi-dimensional; use -M to
specify the dimension of the input data
-n # # # : specify a normal vector for the Poincare plane
-x # # # : specify a point that the Poincare plane passes through
-V : output should be two coordinates lying within plane,
rather than the actual 3-D coordinates
-d # : specify direction of crossing
0 - output only points crossing plane in direction of normal
1 - output only points crossing plane against direction of normal
2 - output all points crossing plane, in either direction
-T # : do not use a plane; instead, strobe the data using the -T
option to specify the strobing period
-o : output should be the embedded time series, rather
than a Poincare section
-P : output should be in form (point,red,green,blue) -- suitable
for piping into psdraw program (see below)
-O : print out all data points on specified (with -d) side of plane,
rather than the intersections with the plane.
WARNING: Currently I have only tested the program
with 3-D data and planes. Program is not designed to work with
higher dimensional data, and may be unreliable for lower dimensions.
The only exception is when the -o option is used; this always works
correctly.
If you have questions, please send me email; email address below.

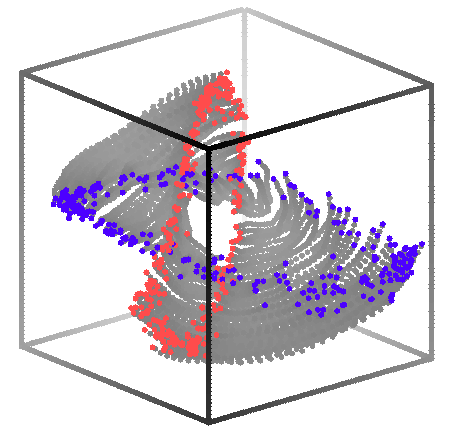
With heavy use of the poincare program, and two other programs I
wrote
(rotate and
psdraw) I
created the following picture:

Red points are crossing towards you, blue away from you.
To make this 3-D plot took some work. Here's what I did:
# Zeroth, I create the 3-D data:
poincare -ot 25 exptqp2.dat > exptqp2.3d
# First, I create the four data sets: a box outlining everything,
# the back half of the attractor, and the two poincare sections for
# orbits crossing in the two directions.
#
rotate -t 40 -p -20 -s 70 -r 180 -b exptqp2.3d > boxqp2
rotate -t 40 -p -20 -s 70 -r 180 -B exptqp2.3d > qp2.3d
cat qp2.3d | poincare -d 1 -OM3 > cutqp2
cat qp2.3d | poincare -M3 > normqp2
cat qp2.3d | poincare -d 1 -M3 > nnormqp2
# Second, I tag each of the files so I can color them separately
#
cat boxqp2 cutqp2 | gawk '{print $1,$2,$3,1}' > tempqp2a
cat normqp2 | gawk '{print $1,$2,$3,2}' > tempqp2b
cat nnormqp2 | gawk '{print $1,$2,$3,3}' > tempqp2c
# sort for 3-D plotting; then apply a color to each point. I'm doing
# the depth shading by hand for the attractor & box, and coloring the
# poincare section points red & blue.
#
cat tempqp2[abc] | sort -n +2 -3 | gawk '
($4==1) {x=1-($3+1.654)/(2*1.654);print $1,$2,x,x,x}
($4==2) {print $1,$2,1,0.3,0.3}
($4==3) {print $1,$2,0.3,0,3.1}' > toplotqp2
cat toplotqp2 | psdraw -X -1.45 1.45 -1.45 1.45 -COc 0.1 > poin.ps

The graph was made with a program I wrote,
psdraw. This program is public domain. The program makes
PostScript output
which I then converted to GIF.
Some links...
Current address:
Eric R. Weeks
weeks@physics.emory.edu
Department of Physics
Emory University
Atlanta, GA 30322-2430
![]()
![]()
 Click here to download software.
To compile, use "cc -o poincare poin.c -lm".
![]()
![]()